A report somebody
would actually read.
Not a screenshot of a dashboard. A print first A4 document with a cover, an executive summary, analysis, geography and recommendations, generated from the same live queries the product draws on screen.
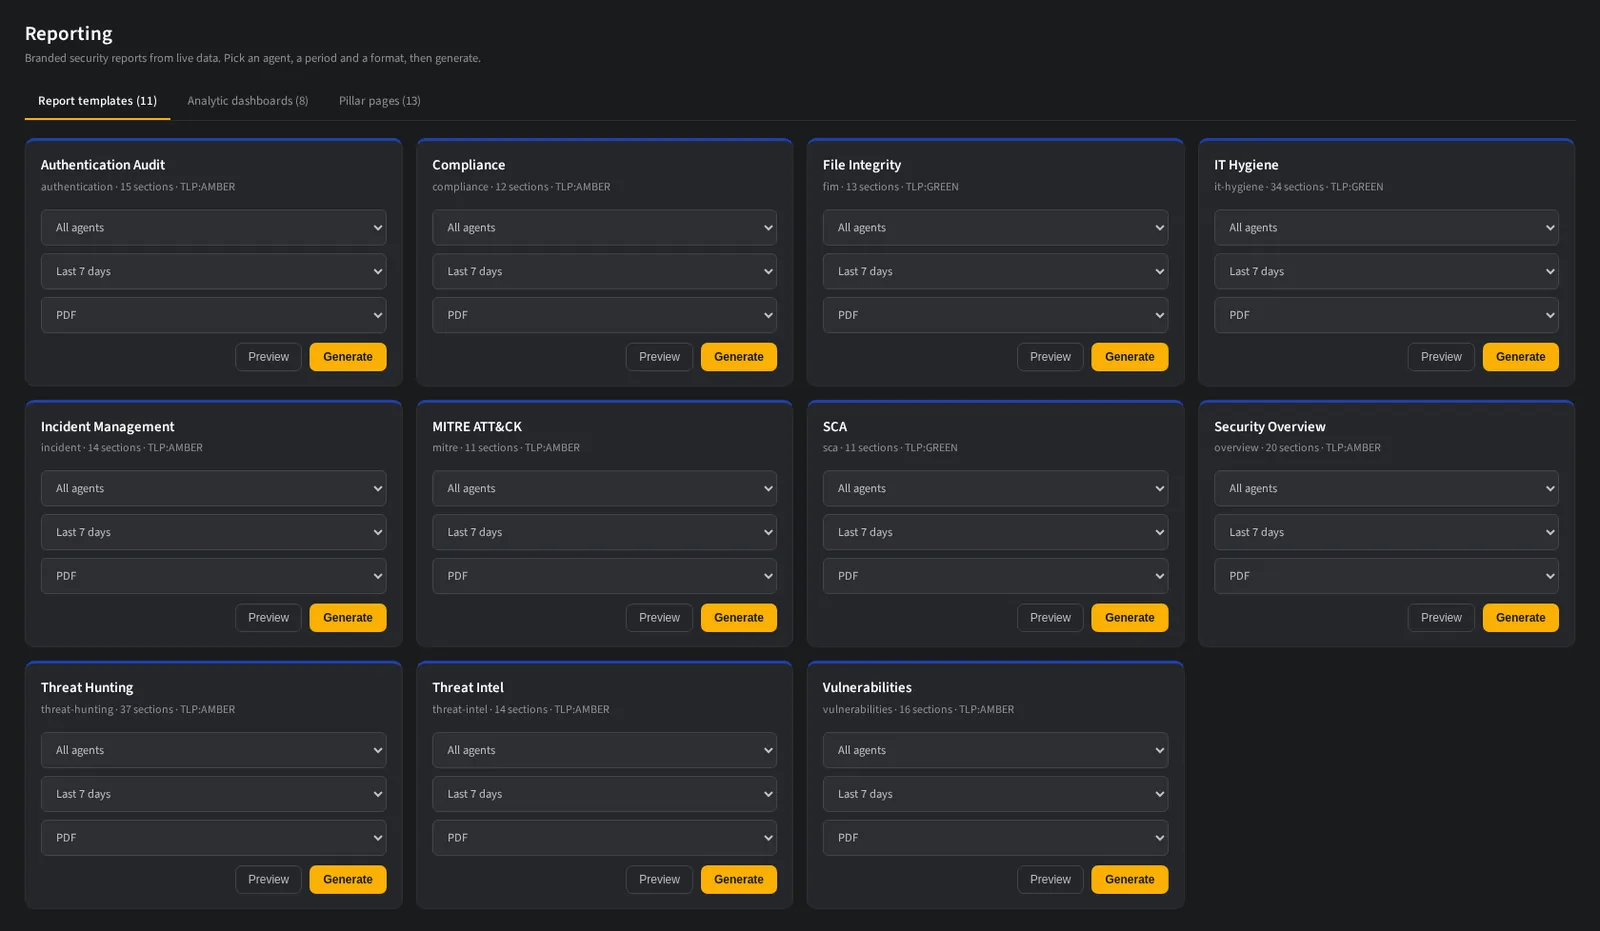
Thirteen report templates, grouped by pillar. Pick scope, period and format.
Built for the page, not for a screenshot.
Screen layouts print badly: charts clip, tables run off the edge and a tab break leaves a page eight tenths empty. The report engine is a separate print first template with a real page model, so what comes out is a document rather than a capture.
- ▸A real structure. Cover, executive summary, analysis, optional geography, notable findings and recommendations.
- ▸Tables fit the page. Fixed layout with truncation and a tooltip, so a long file path never runs off the paper.
- ▸Charts are redrawn for print rather than screenshotted, so they stay sharp at any zoom.
- ▸Pages pack. Content flows and paginates naturally instead of leaving mostly blank pages behind a section break.
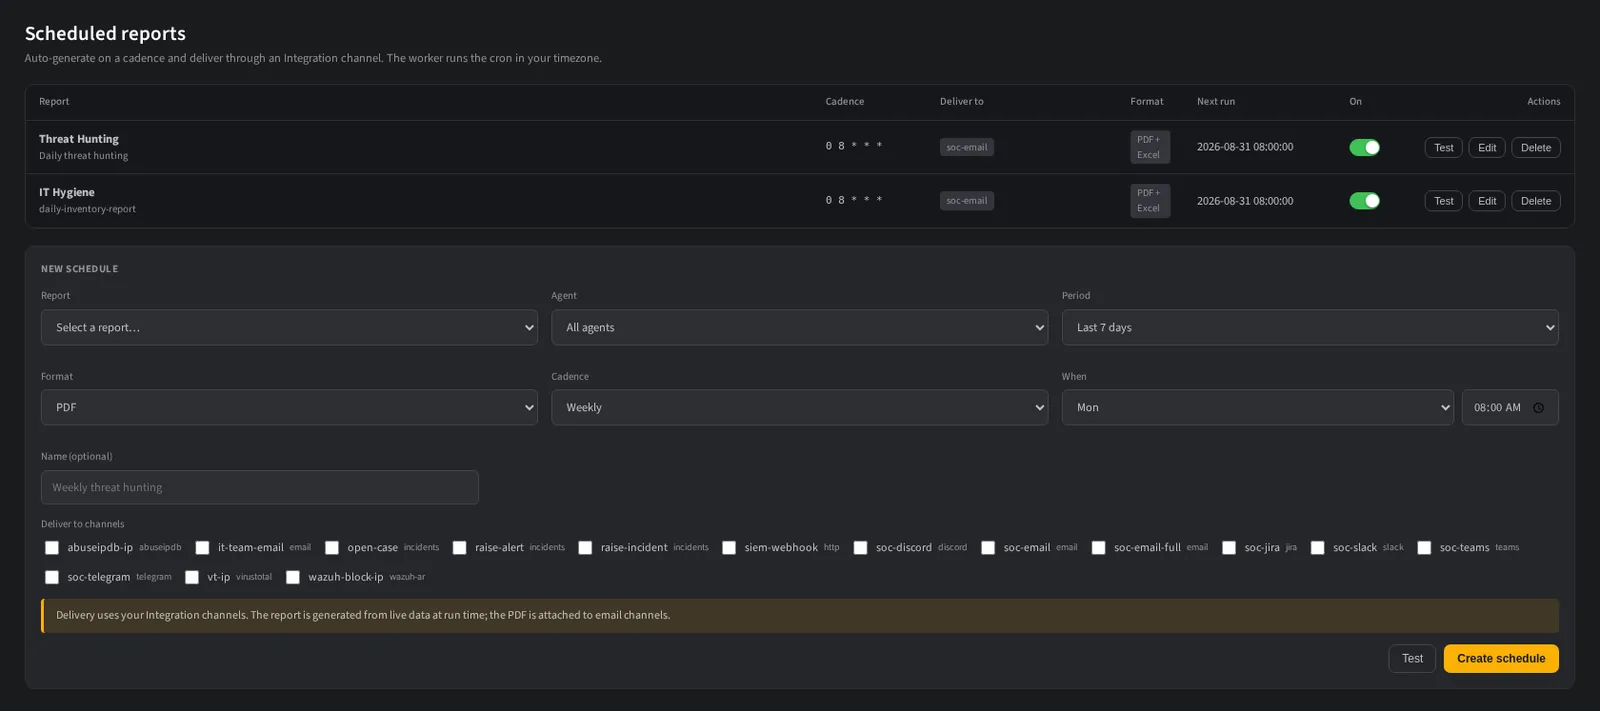
Scheduled reports with cadence, channel, format and the next run in your timezone.
One is the summary. One is the data.
A PDF that tries to be a data export is unreadable, and a spreadsheet that tries to be a narrative is useless. So the same report renders twice: the PDF summarises with a row cap, and the workbook carries the detail across labelled sheets.
- ▸PDF is a summary. Capped rows by default, ordered by severity, so a page is readable at a glance.
- ▸Excel is the data. Summary, detection, hosts, geography and findings as separate sheets.
- ▸Event tables are deduplicated. The same alert firing five hundred times is one row with a count, not five hundred rows.
- ▸Row limits are settings. Twenty five for PDF and one hundred for Excel by default, editable per format.
It arrives without anyone remembering.
A report you have to log in and generate is a report nobody reads. Schedules are five field cron evaluated in your timezone, they generate off the request path so a long report cannot time out a browser, and they deliver to any configured channel.
- ▸Cron in your timezone. Monday at eight means eight where you are, not eight UTC.
- ▸Generated by a worker. The job is queued and rendered in the background, then filed in the archive.
- ▸Delivered to a channel. Email with the PDF attached, or any other channel you have configured.
- ▸Both formats in one run. A schedule can emit the PDF and the workbook together, each with its own row cap.
Report, period, agent scope, format, cadence and channel, in one row.
Your logo, your window, your estate.
Every report honours the agent scope and the time window you set, and carries your organisation branding rather than the vendor name. Generated reports are kept in an archive with a retention you control.
- ▸Agent scope and period apply to every query in the document, so a per customer report is one setting.
- ▸Branding is configuration. Logo, organisation name and accent colour, changed in settings rather than by a support ticket.
- ▸Any dashboard exports too. A board you built runs through the same pipeline as the built in templates.
- ▸Archive with retention. Old reports are removed automatically after the number of days you choose, or kept forever.
Bring the report you assemble
by hand each month.
Show us the monthly pack somebody builds from screenshots. We will generate it from live data and put it on a schedule.
Powered by Codesecure Solutions. Self hosted, cloud or fully managed.